Wheat Analysis System – Interpretation of Data
MIXOGRAM REFERENCE CHART
(click to see the figure)
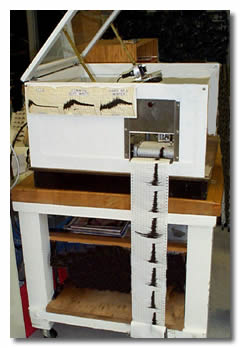 A mixogram is conducted with 10g of flour and the appropriate amount of water to give optimum absorption. The mixograph is a recording mixer reflecting the resistance of the dough during mixing. Most mixograms are run 5 to 8 minutes, which is sufficient time for most flours to exhibit their mixing time to peak and dough breakdown. Dough breakdown behavior is reflected in the tail of the curve when mixing continues beyond the mixing peak and is commonly referred to as mixing tolerance. The mixogram is used to characterize new selections as to market class and to predict baking properties.
For desirable bread-type flour, from Hard Red and White, Winter and Spring selections with adequate flour protein, a mixogram should have the following properties: high water absorption, moderately long mixing requirements (3-6 minutes), strong gluten strength, good dough mixing tolerance, minimum oxidation requirements. Good dough mixing tolerance, as seen on the mixogram would indicate that a bread dough should be elastic after mixing. Extremely long mixing time is considered undesirable because the power and time requirements would be excessive in a commercial bakery. In addition, extremely long mixing time is often associated with tough, bucky doughs which do not perform properly in a mechanized bakery.
Desirable pastry and confectionary flours (i.e. non bread-type flours) from Common Soft White and Club, Winter and Spring selections, should be soft, velvety and low in protein content. Their mixograms should have the following properties: low water absorption, short mixing requirement and no appreciable development with continued mixing, i.e. the mixing curve area should be low, showing weak and very mellow gluten strength. Club wheat flour should have lower water absorption and weaker mixing properties and gluten strength than the Soft Common wheat flours.
The mixograms are visually evaluated for gluten strength and mixing properties. Mixogram absorption (MABS) is optimum flour water absorption and is reported as per cent by weight, corrected to a 14% flour moisture basis. MABS is a function of protein content, variety, flour moisture and environment. For bread-type wheat flour, MABS is used to estimate the bread baking absorption (BABS). The mixogram mixing time (not reported) is used to estimate the optimum bread dough mixing time (MTIME). Mixogram curves of bread-type flours with undesirable traits (low flour protein, short mixing time, poor mixing tolerance, weak gluten strength and low water absorption) are often eliminated from further testing, i.e. bread baking, in the hurdle (screening) process. Generally, a single undesirable property for any one of the important mixogram properties is sufficient to classify a selection as undesirable.
Final evaluation must be made with consideration to the protein content of the flour due to the effect of protein content on mixing characteristics even within the same variety. As protein increases, mixing time will decrease. This is illustrated on the Mixogram Reference Chart. Compare #1 high(H) with #2 medium (M) and #3 low(L) which are typical mixograms of the club wheat Tres at 12, 9 and 6% protein, respectively. Similarly, 2H, 3M and 4L are typical for Stephens at these protein levels. Little change can be observed on any wheat above 13.0 or below 7.5% protein.
The Mixogram Reference Chart is used to identify the curve characteristics which most closely match the sample chart identifiers, i.e. 1L, 1M, 1H, etc. through 8H and are reported as Mixograph Type (MTYPE).
Desirable mixogram characteristics of bread type flours would be characterized on the Reference Chart as high (H) Mixogram type (MTYPE) with preference ranging from 3H to 6H. Desirable mixogram characteristics of non-bread type (pastry flours) would be characterized on the Reference Chart as low (L) or medium (M) Mixogram Type (MTYPE). Preference would be for mixograms in the low (L) category. As described above, this is dependent on protein content.
Bread Baking
Bread crumb grain is visually evaluated by a team of trained bakers. Table 1 describes the coding system used for reporting this evaluation.
| CODE | MEANING |
|---|---|
| 1 | Excellent |
| 2 | Satisfactory |
| 3 | (Intermediate) |
| 4 | Questionable-Satisfactory |
| 5 | (Intermediate) |
| 6 | Questionable |
| 7 | (Intermediate) |
| 8 | Questionable-Unsatisfactory |
| 9 | Unsatisfactory |
WAS COMPUTER GRADING SYSTEM
The Wheat Analysis System [WAS; (13),(14)] grades the experimental lines in comparison to a check(s). The system relies on nursery “checks” (standards) and historical standard deviation “windows”. The mean of the nursery standards is used to “center” the window. Experimental lines with values that lie within this window are not flagged. Lines with values that lie outside the window are flagged accordingly: “-” for 1 to 2 s.d. poorer than the standard mean, “-2” for 2 or more s.d. poorer than the standard mean, “+” for 1 to 2 s.d. better than the standard mean, “+2” for 2 or more s.d. better than the standard mean. Note also that lines are scored based on desired quality, e.g. greater ash values give increasingly negative scores (lower ash is preferred) and protein is scored according to whether the market class is hard or soft. Those cultivars used as standards are indicated with an “*” immediately to the left of the SAMPLE #.
Below the nursery data is a single line which keys the standards (*), lists the mean flour protein for the entire nursery, and describes the type of mill used for flour milling (Buhler, Quad or Short-Quad). Below this line are statistics generated by the computer grading system. They are listed by class. Included here are the mean values for the standards (SM) and the means and standard deviations for the experimental (NM and NSD respectively). (Note that “check” varieties not marked as standards are treated as experimental). Note too, that standards are not necessarily “class-specific”. For example, if there are no check varieties in the HWS, WAS will prompt for the class of check variety to compare to (13),(14).